To report, or not report...
Everyone needs goals. But to achieve them, they have to be measurable. Most people understand that.
Know what they don't understand? That PowerPoint slide someone just put up on the projector in the boardroom! Could that copy-and-pasted spreadsheet be any less legible up there? Probably not.
Infographics and dashboards are a great solution for this. A properly designed report or dashboard interface can fill an executive's heart with joy for the foreseeable future, as long as you're hitting your numbers...
Putting your KPI data into a web-based interface might even make those stuffy, high-pressure boardroom meetings unnecessary.
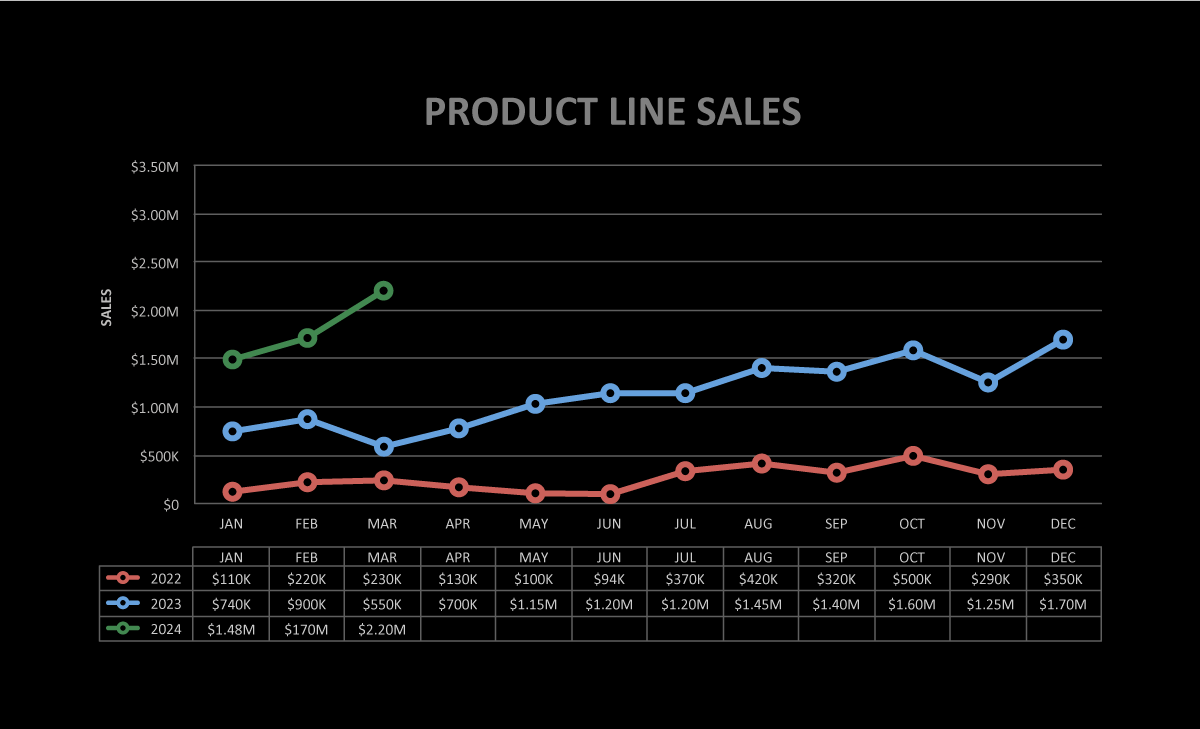
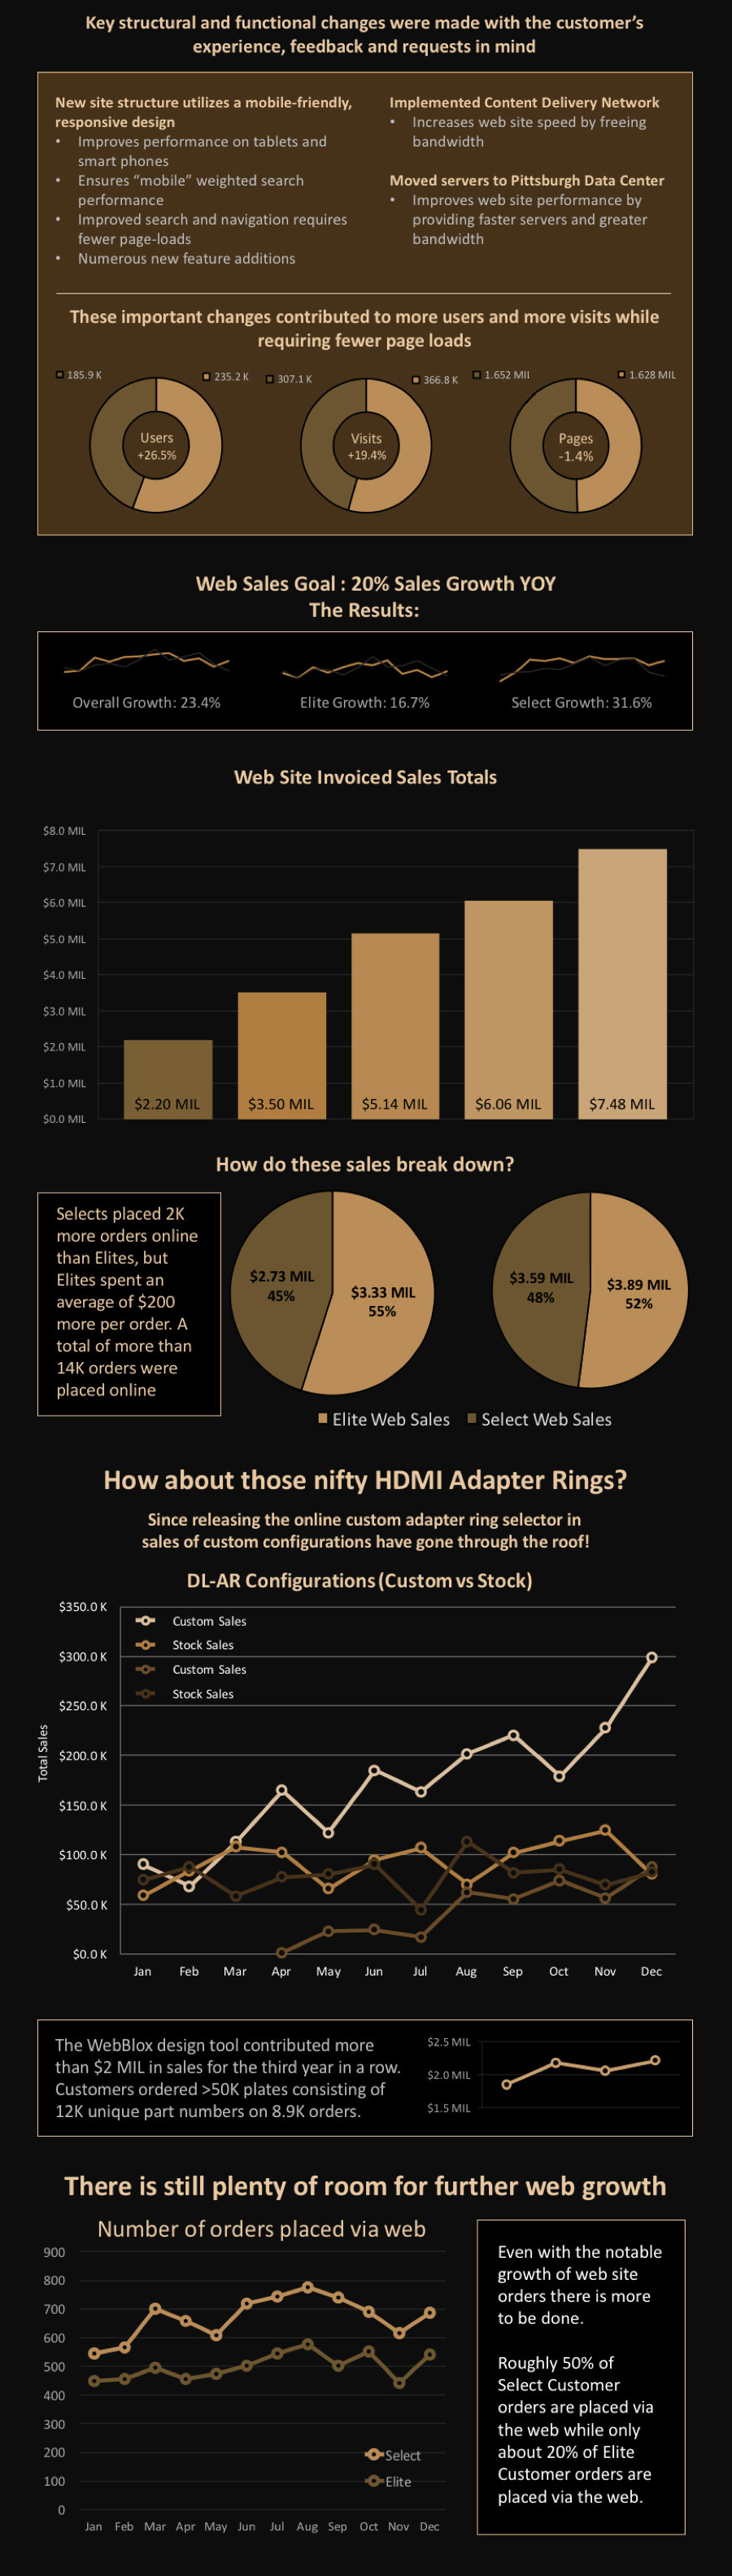
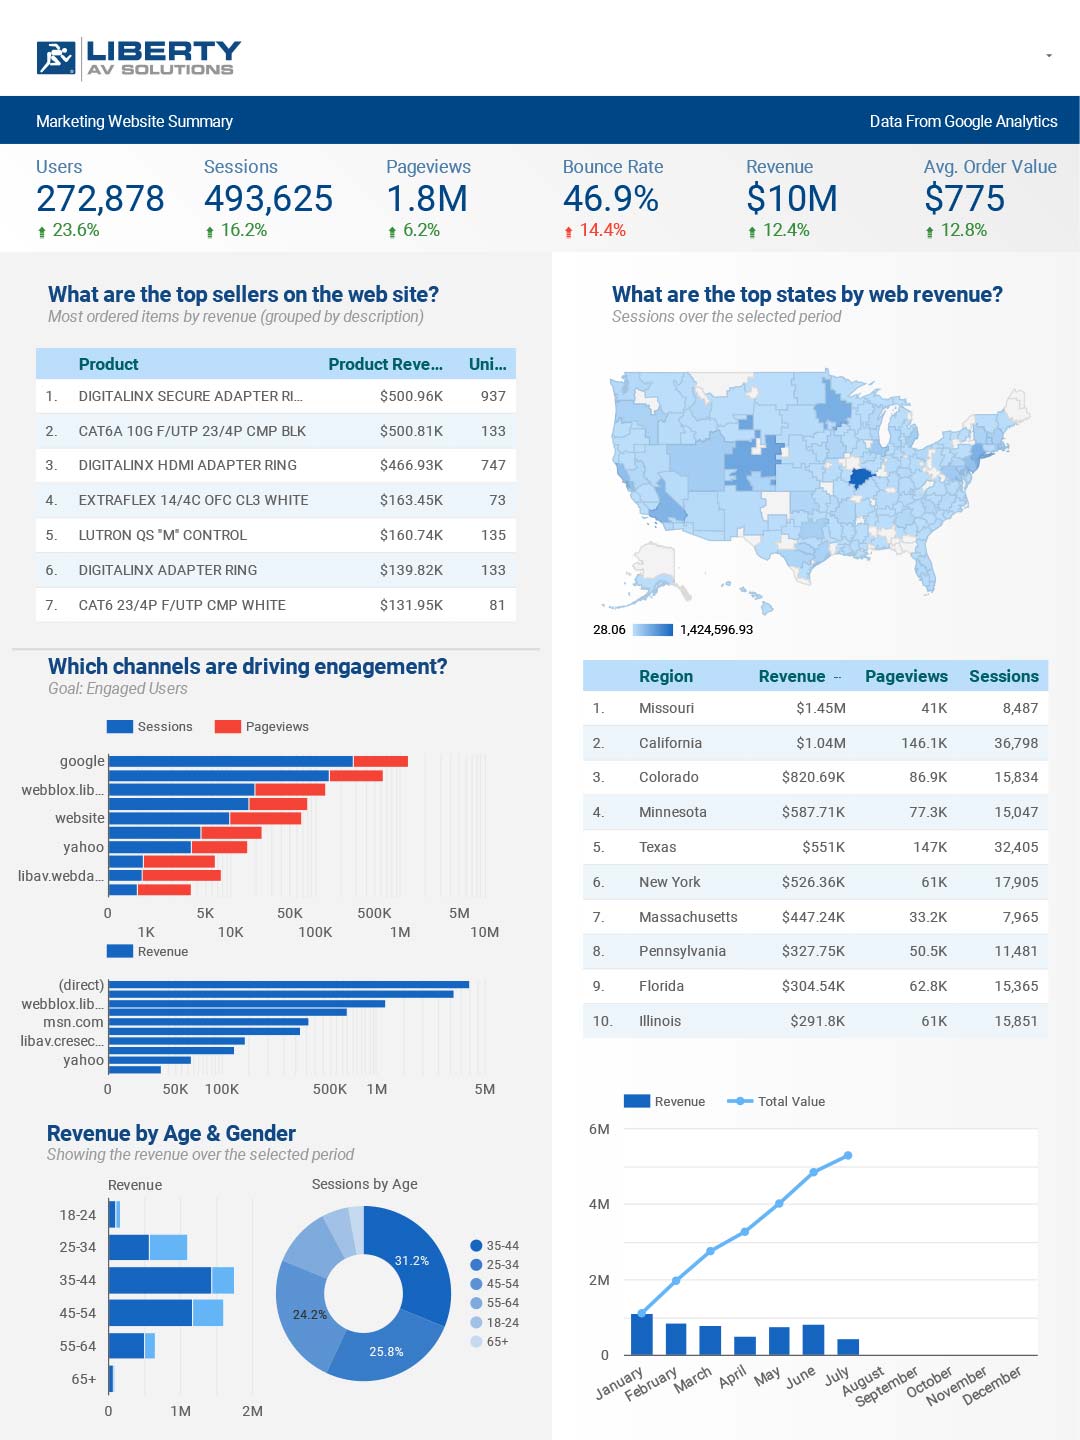
Below are a couple examples.